We use Baltimore's public data to bring visibility and accountability to the work of building a city for people.
Every dashboard takes one honest question about our streets and answers it with the city's own numbers.
We gather public data, published plans, and information from city and state websites and dashboards.
We consolidate that data into dashboards and project trackers that aim to be user-friendly.
This gives advocates, neighbors, and officials a shared starting point for advocacy, empowering us to demand change.
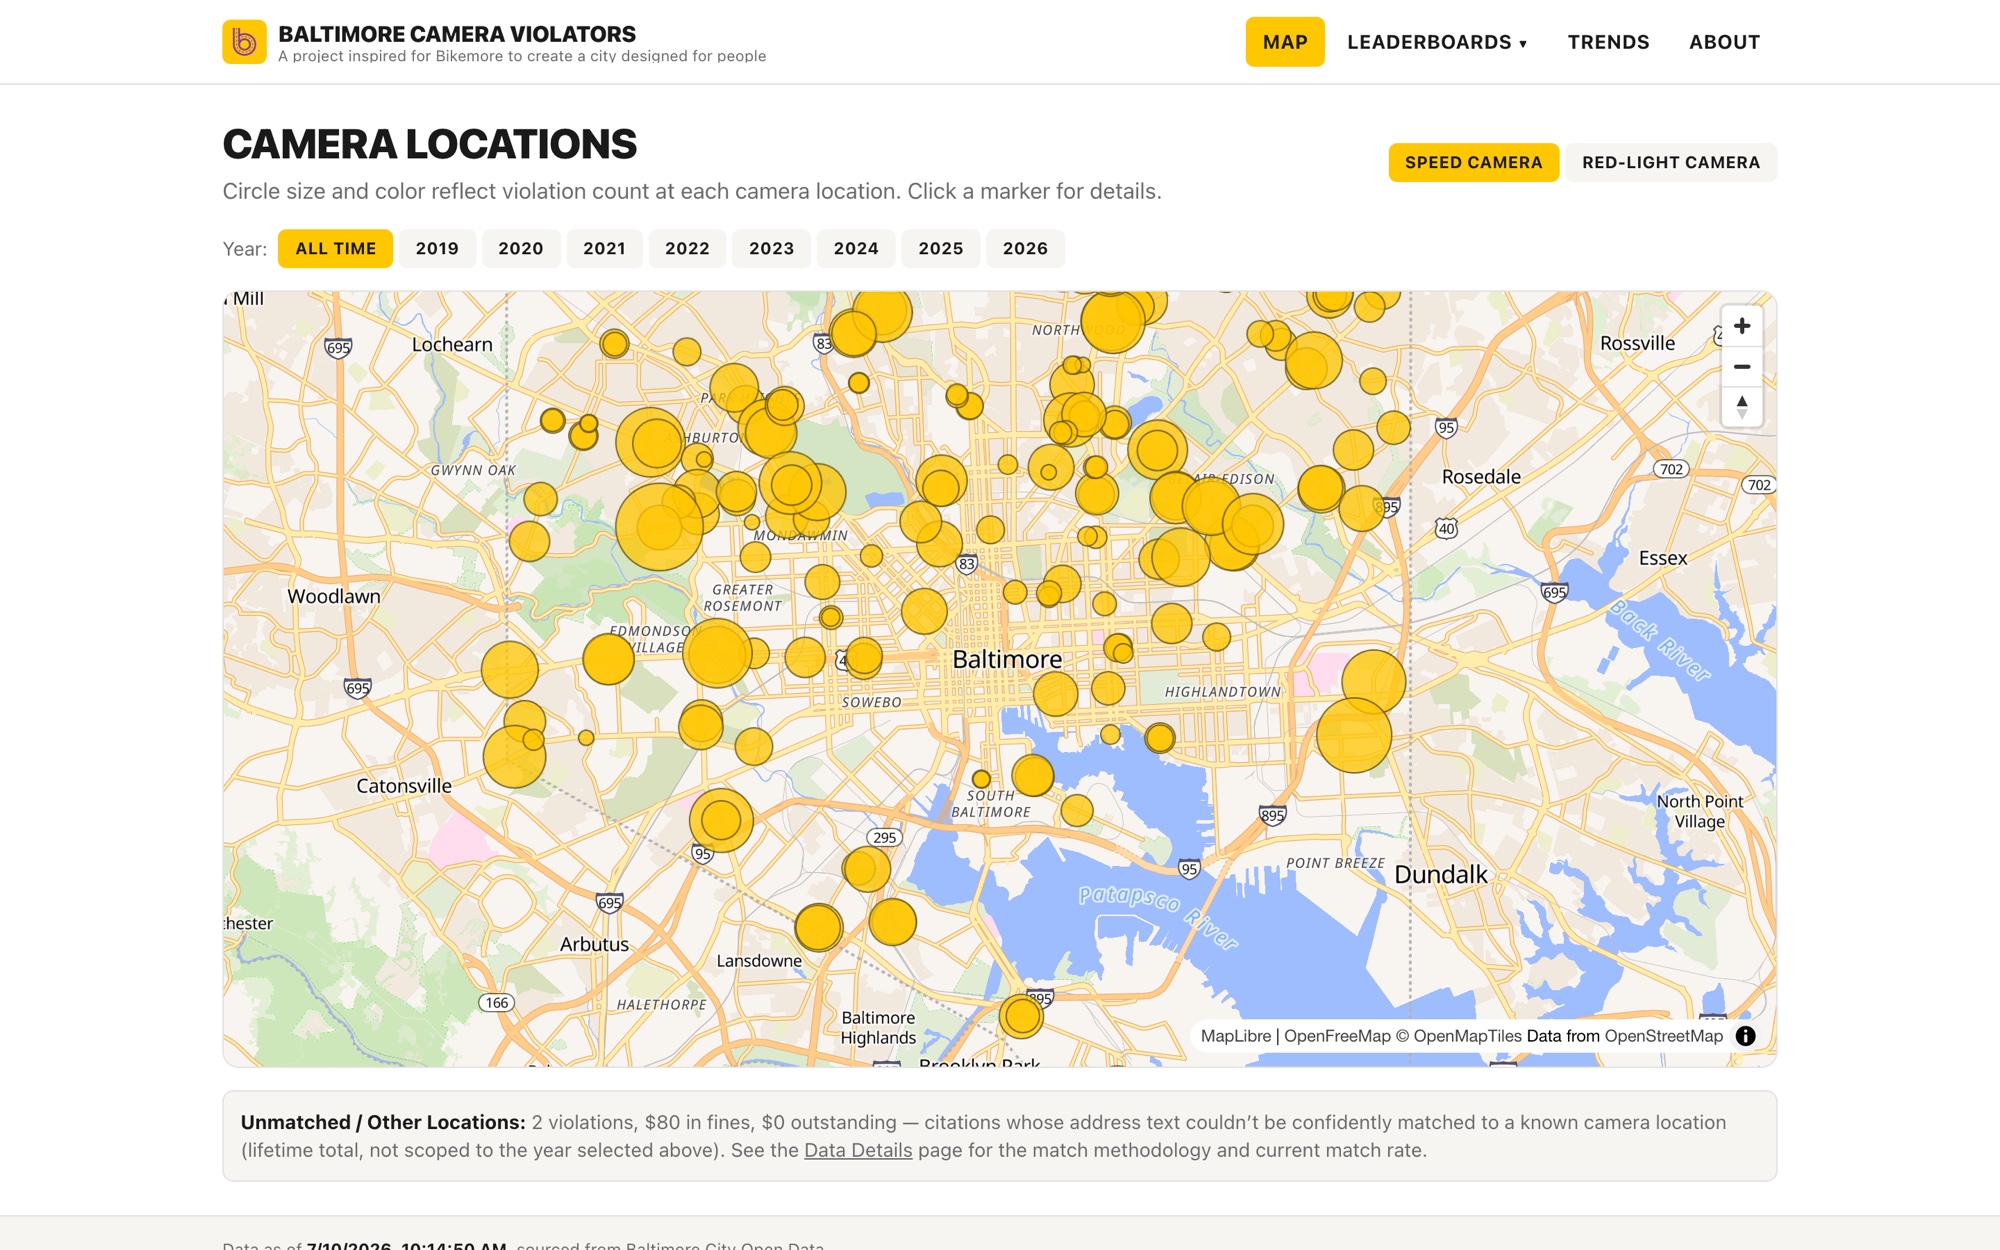
Every Baltimore camera citation since 2019 — as leaderboards, a camera map, and monthly trends.
Baltimore ATVES citations · City Open Data
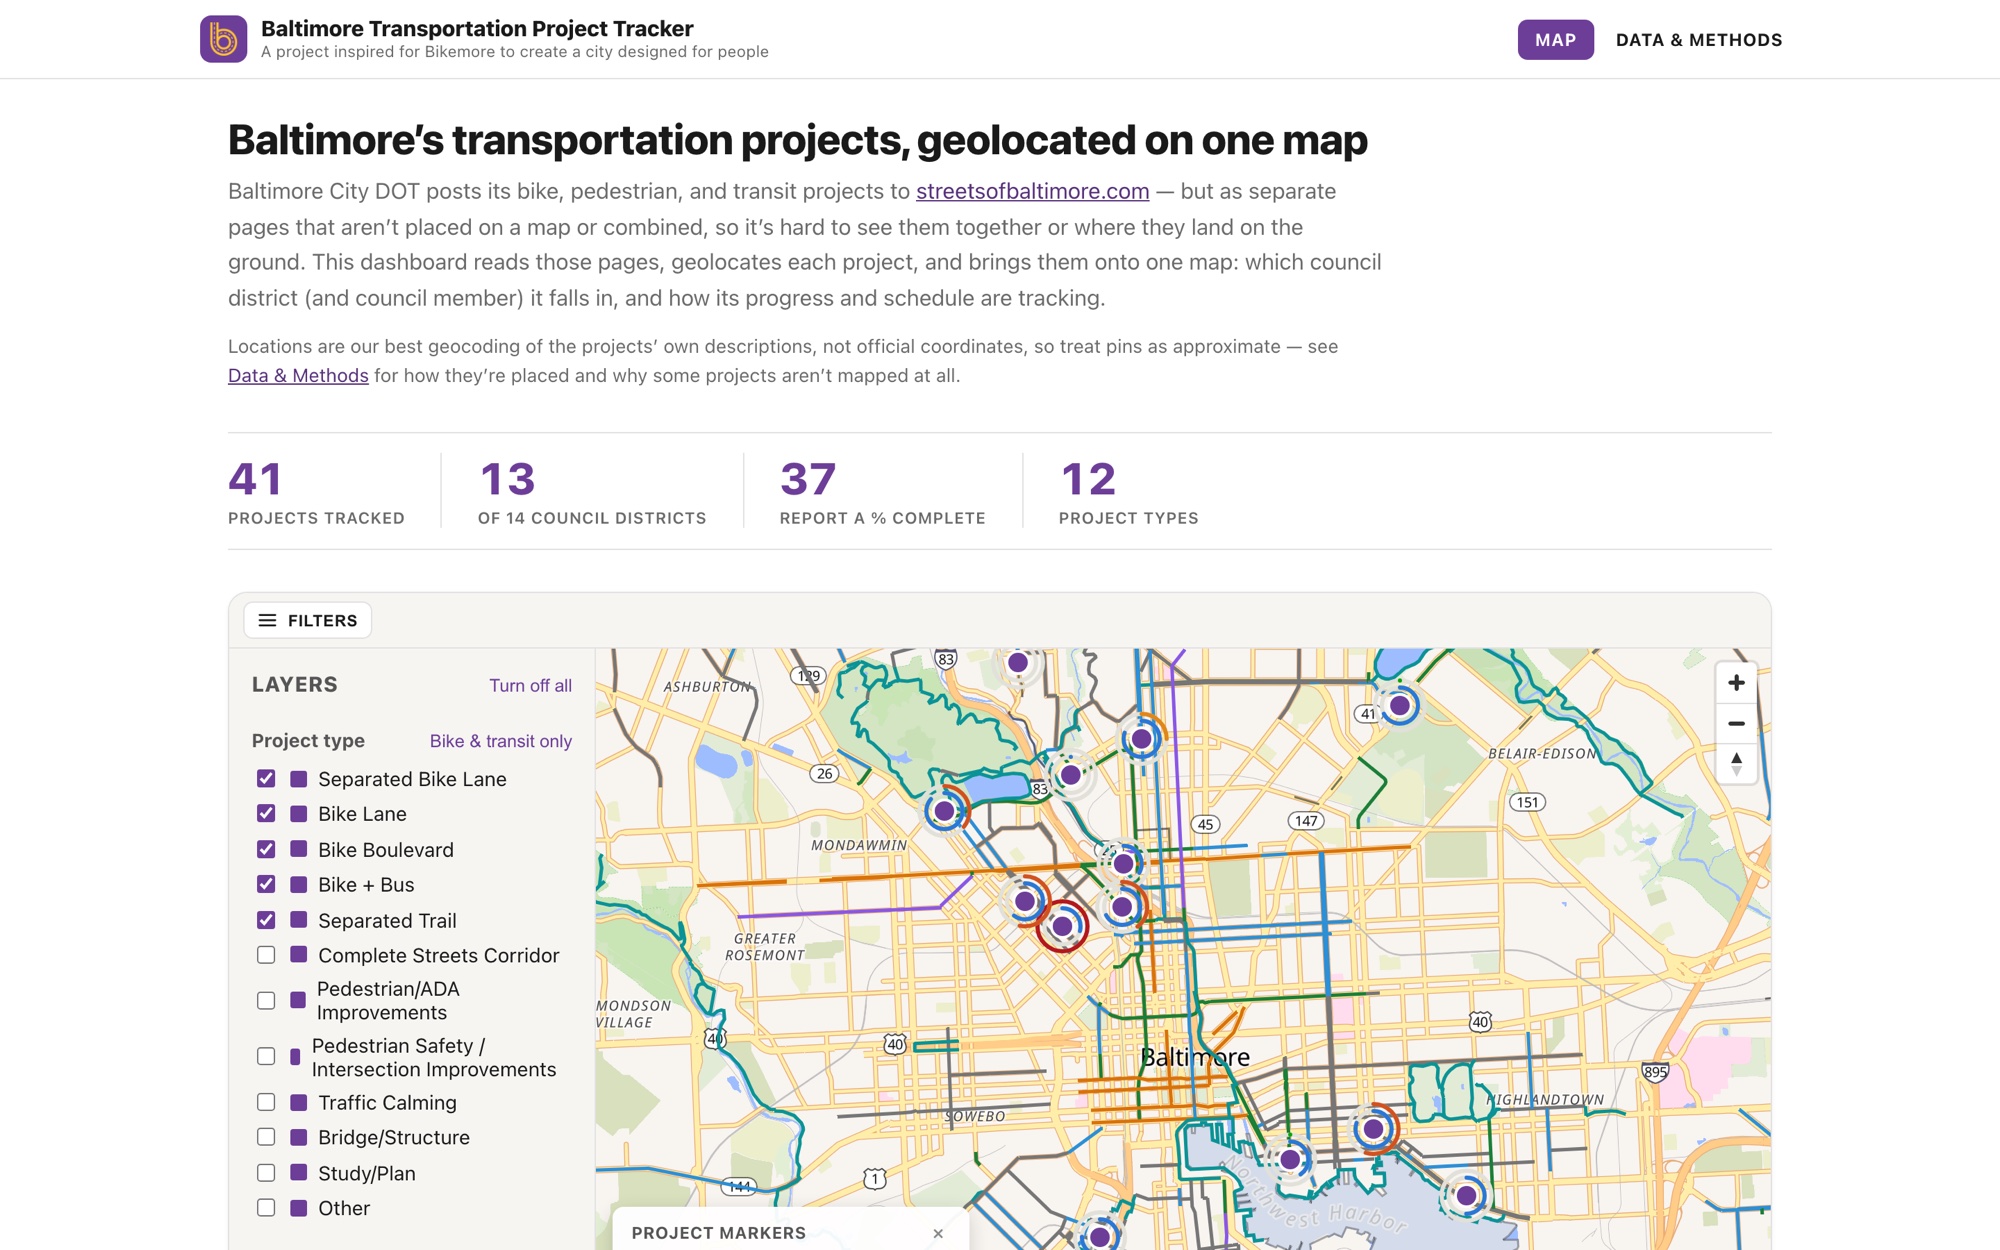
Open dashboard →Every City DOT bike, pedestrian, and transit project geolocated on one map, by council district.
Streets of Baltimore + Open Baltimore GIS
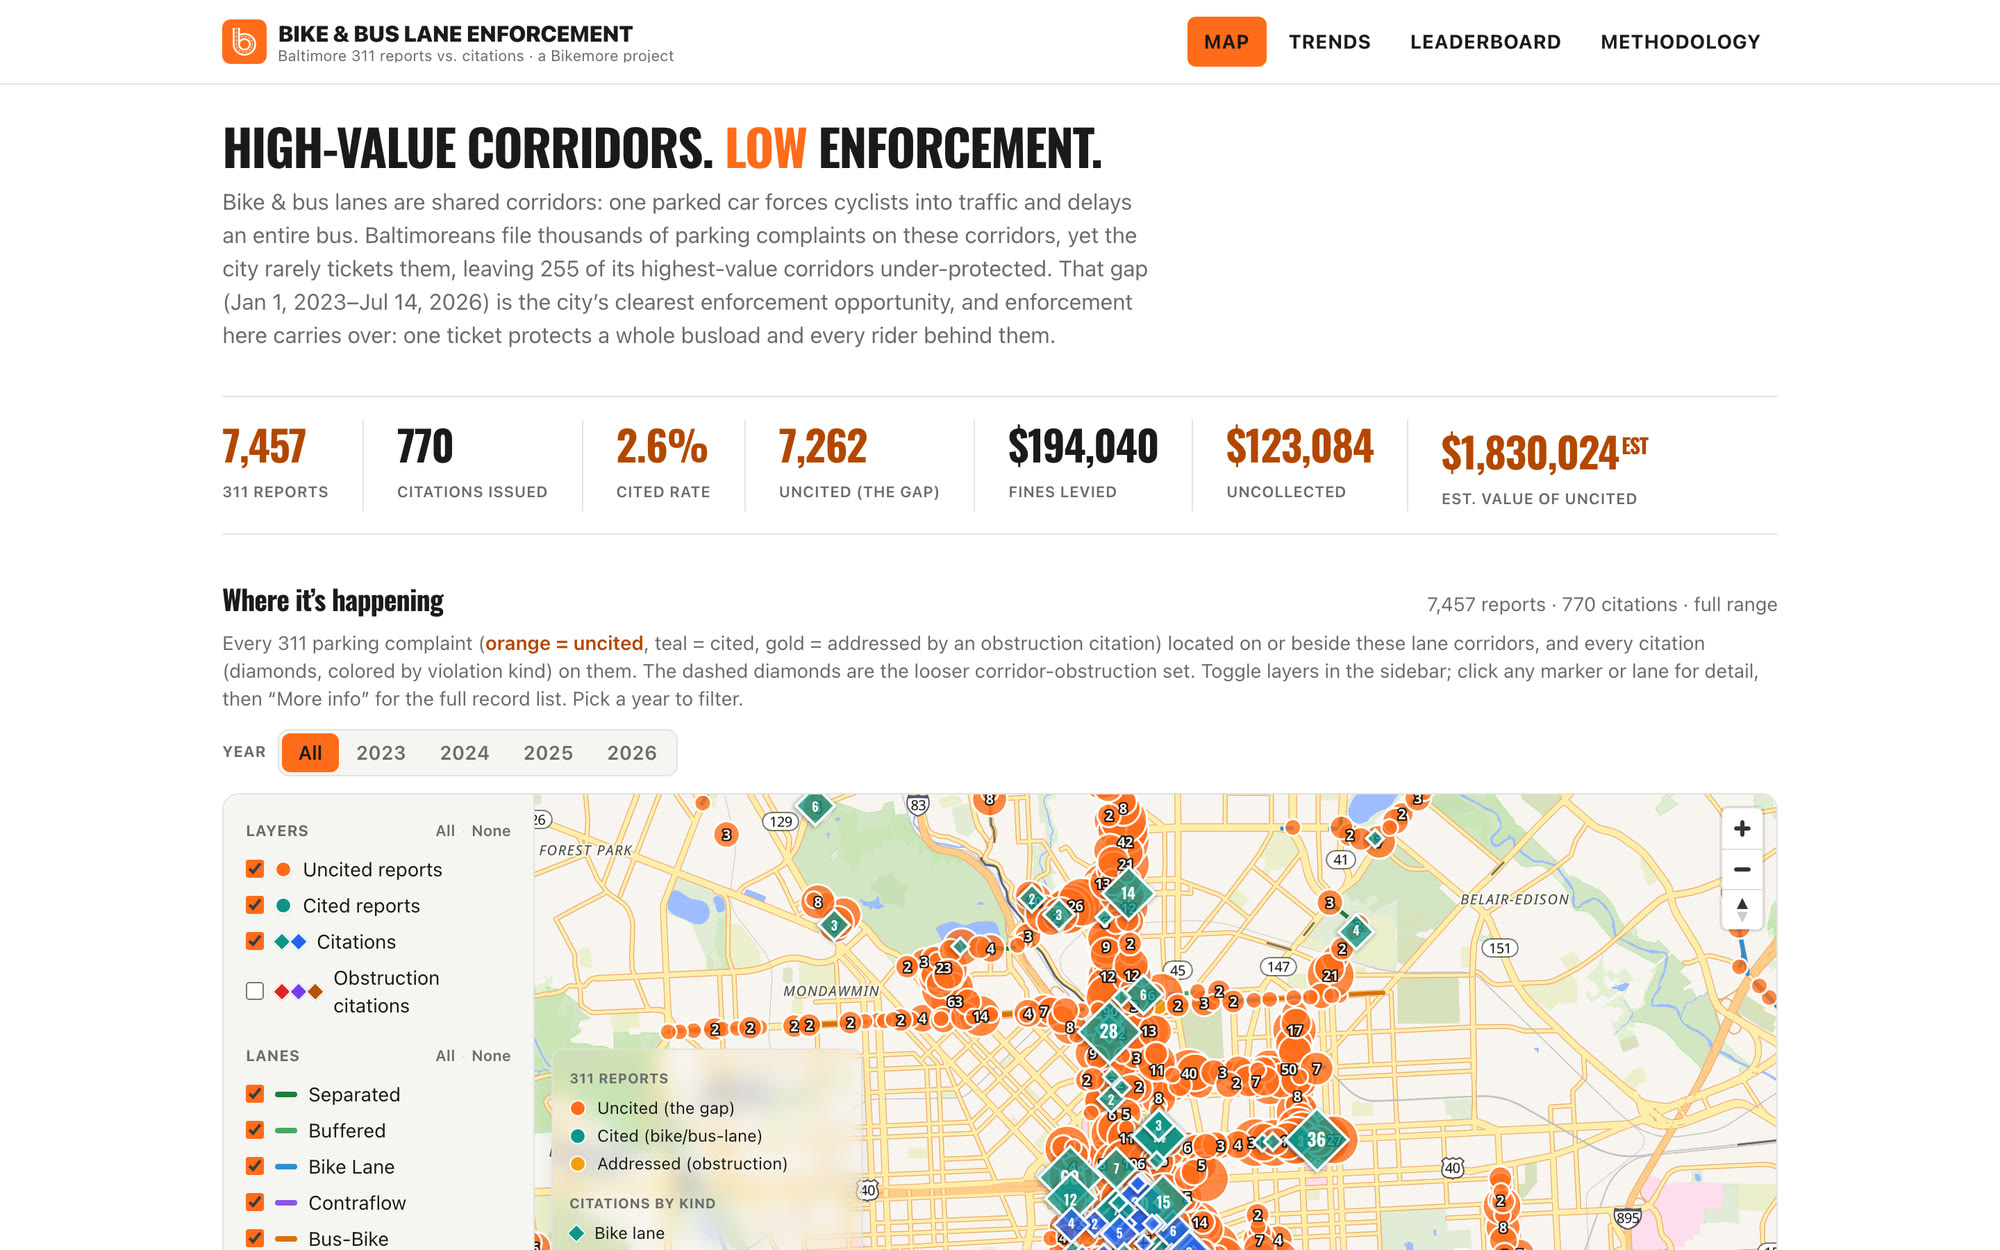
Open dashboard →Baltimoreans filed 7,457 complaints about blocked bike and bus lanes. The city wrote 770 tickets.
Baltimore 311 & parking citations · Open Data + BCDOT
Open dashboard →
This data work supports Bikemore's fight for streets that put people before cars. If it's useful to you, fuel the advocacy behind it.